Test a five-point larger down payment
Down payment (%): 20% → 25%
Estimated owner wealth₹85,51,552₹88,31,528
PLANNING · FREE TOOL
Compare projected renter investments with home-owner equity. Adjust the assumptions and see how the result changes.
Interactive tool
Change the inputs to compare scenarios. Your values stay in this browser.
Simplified scenario excludes stamp duty, transaction taxes, rent deposits, property tax, selling costs and non-financial housing value.
QUICK TAKEAWAY
This is a result from the assumptions currently entered. Compare a few alternatives below before drawing conclusions.
BASED ON YOUR INPUTS
With these inputs, estimated owner wealth is ₹85,51,552.
For context, renter investment estimate is ₹85,51,425.
Test a five-point larger down payment changes estimated owner wealth from ₹85,51,552 to ₹88,31,528 in this model.
Model note: Simplified scenario excludes stamp duty, transaction taxes, rent deposits, property tax, selling costs and non-financial housing value.
TRY A DIFFERENT ASSUMPTION
Each card recalculates from the inputs above.
Down payment (%): 20% → 25%
Years to compare: 10 → 15
Calculations run locally. Browser activity remembers calculator visits and quiz scores only—not financial inputs or results. Share links include values only when you choose to share them.
PaisaCalc guide · India

The Rent vs Buy Calculator is a planning tool for comparing two housing paths over a chosen number of years. You enter a home price, monthly rent, down payment, home-loan rate and tenure, expected home appreciation, annual rent increase, investment return, and maintenance percentage. It estimates the buyer’s home equity and the renter’s investment wealth at the same end date.
The result is a simplified, pre-tax estimate—not a verdict on where you should live. Buying converts part of each EMI into equity, while renting can leave the down payment and monthly difference available for investing. It uses Indian rupees and annual percentages, but cannot know a city’s prices, lease terms, building quality, or risk tolerance.
A headline EMI can look comparable with rent, yet the cash flows differ. A buyer commits a down payment, pays interest and maintenance, and accepts less mobility. A renter pays rent but may invest capital not locked into property. Comparing both paths over one horizon makes this opportunity cost visible.
The answer can change sharply between Mumbai, Bengaluru, Jaipur, or a smaller town because the rent-to-price relationship differs by neighbourhood. A long intended stay may make transaction costs and equity accumulation more relevant; a short stay makes selling friction, relocation, and flexibility more important. Use the comparison to frame questions, not to replace legal, lending, or investment advice.
First, the model calculates loan principal as home price multiplied by one minus the down-payment percentage. It estimates a fixed-rate EMI and tracks the remaining balance at the comparison year. Projected home value grows at the assumed appreciation rate. Owner equity is that value less the remaining balance; annual maintenance is an owner cash cost.
For the renter, the down payment is invested at the assumed return. Each month, the model compares owner recurring cost with rent, including EMI and maintenance. A positive difference is invested; a negative difference reduces the renter contribution in this simplified comparison. Contributions accumulate at the entered return. Timing, taxes, deposits, and one-time fees are simplified.
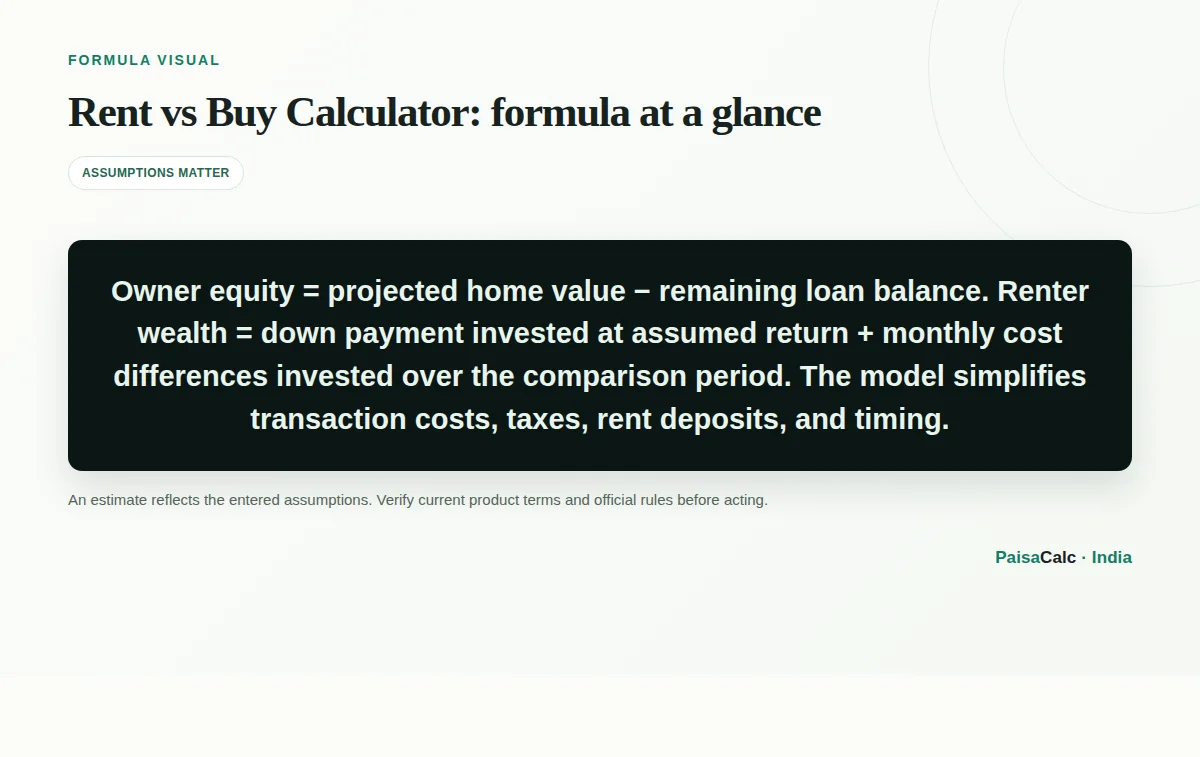
Loan principal = home price × (1 − down payment ÷ 100). For monthly rate r and n monthly instalments, EMI = P × r × (1+r)^n ÷ ((1+r)^n − 1); when the entered annual rate is zero, the principal is divided across n months. The balance after k payments is estimated from the standard amortisation schedule. These equations describe a level-rate loan, even though many Indian home loans can reset.
Projected home value = price × (1 + appreciation ÷ 100)^years. Owner equity = projected home value − remaining loan balance. Renter wealth combines the down payment compounded for the horizon with recurring monthly differences compounded at the assumed return. The calculation is nominal: it does not separately subtract income tax, capital-gains tax, stamp duty, registration, brokerage, insurance, property tax, society charges, or sale costs.
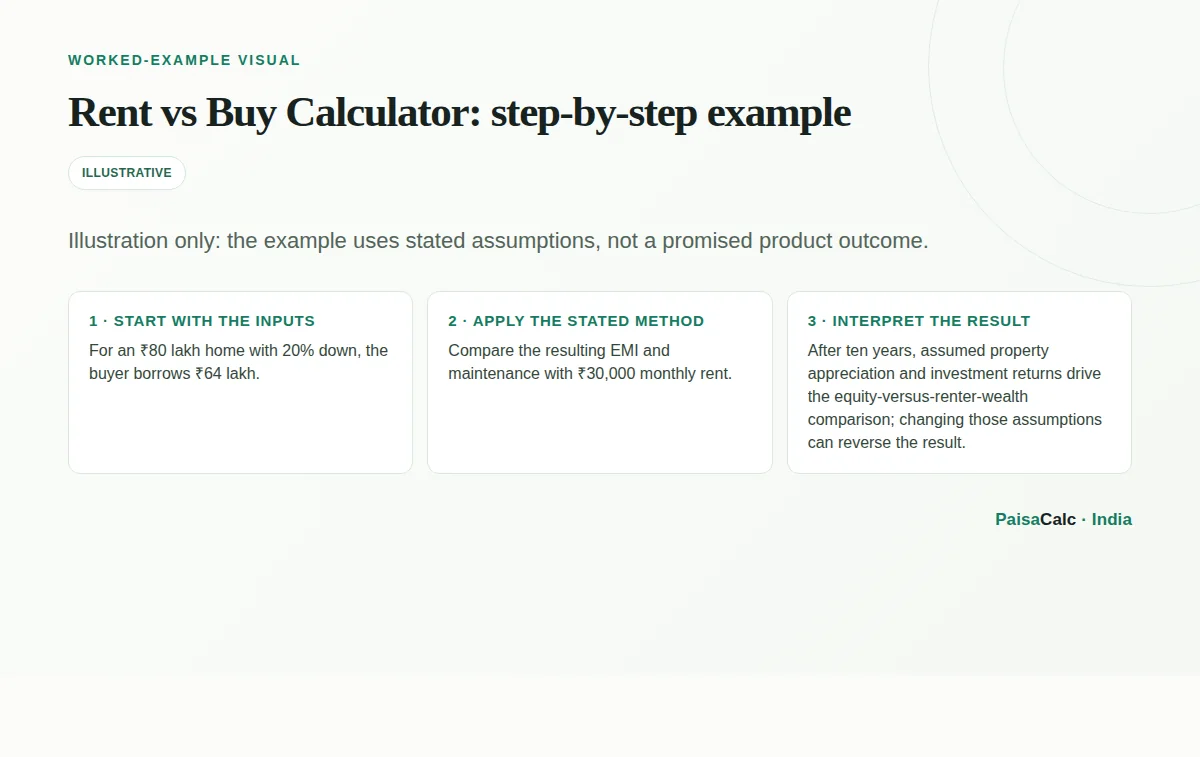
Suppose a household considers an ₹80,00,000 home, pays 20% down (₹16,00,000), and finances ₹64,00,000. Enter ₹30,000 rent, an 8.5% loan rate, 20-year tenure, 10-year horizon, 5% appreciation, 5% rent growth, 8% investment return, and 1% maintenance. The calculator estimates EMI, the balance after 120 months, and value after ten annual growth periods.
It compares buyer equity with the renter’s ₹16,00,000 investment plus monthly differences. This is not a promise: changing assumptions can reverse the ranking. Run lower, base, and higher assumptions, then add realistic purchase and moving costs outside the simplified result.
A first-time buyer can test whether a proposed price is sensible relative to nearby rent, rather than assuming that owning is automatically cheaper. Enter the rent for a comparable home—not a smaller flat or a different commute—and include a down payment that does not exhaust the emergency fund. A borrower can also compare a shorter planned stay with the full loan tenure.
A relocating professional may model renting for five years while investing the intended down payment, then test a ten- or fifteen-year horizon. A dual-income family can vary rent growth and income stability, while an investor can stress-test a high-price, low-rent property. In each case, separately review title, RERA information where applicable, registration and stamp-duty estimates, loan terms, maintenance, and the practical value of location.
The main benefit is symmetry: both choices are evaluated at one end date with explicit starting capital and recurring cash-flow assumptions. The table shows why a renter may accumulate more wealth, or why a buyer may finish with equity despite higher outflow.
It also encourages sensitivity testing. A one-percentage-point change in appreciation or investment return is not a small detail over a decade, and rent escalation affects affordability. Showing these inputs in one place helps a household discuss liquidity, job mobility, preferred neighbourhood, debt comfort, and the non-financial value of stable tenure instead of relying on a single social rule such as “rent is wasted.”
Do not compare rent with EMI alone: EMI includes principal repayment, while rent does not create equity. Conversely, do not treat the entire home value as profit; deduct the outstanding loan. Omissions include down-payment opportunity cost, maintenance, property tax, society charges, insurance, repairs, brokerage, deposit, stamp duty, registration, furnishing, and selling costs.
Avoid using guaranteed-sounding assumptions for property appreciation or market returns. A floating-rate loan may not keep the entered rate for the full tenure, and actual rent reviews may differ from a fixed annual percentage. Do not count tax benefits unless you separately verify the current rules and your eligibility. Finally, do not compare different homes: match size, condition, locality, commute, parking, and amenities as closely as possible.
Start with a cash-flow limit rather than the maximum loan offered. Keep money for an emergency reserve, moving costs, and ownership expenses before deciding the down payment. Check EMI affordability if rates reset or one income pauses. Ask the lender about rate type, reset frequency, spread, prepayment terms, insurance, and the full schedule—not only the advertised rate.
Build three cases: conservative, base, and optimistic. Use a lower appreciation and return in the conservative case, a realistic rent path, and a horizon that matches how long you are likely to stay. For a proposed purchase, obtain written estimates for stamp duty, registration, brokerage, maintenance, property tax, and sale expenses; add them to a separate spreadsheet because this calculator intentionally simplifies them. Review the decision annually as income, family needs, and rates change.
The most useful output is the break-even pattern, not a single winner. Vary one input at a time to see whether the result is driven by high appreciation, an aggressive return, low rent, or the horizon. A short horizon can be dominated by entry and exit costs; a long horizon magnifies compounding and exposure to rates, maintenance, and uncertainty.
For a more rigorous personal model, add one-time costs, taxes, insurance, property tax, deposits, furnishing, and a sale price net of selling costs. Treat cash flows on their actual dates and compare after-tax, inflation-adjusted outcomes; the present calculator does not do that. Finally, value housing services separately: a school catchment, predictable tenure, family support, or the ability to move for work may rationally outweigh a small difference in modelled wealth.
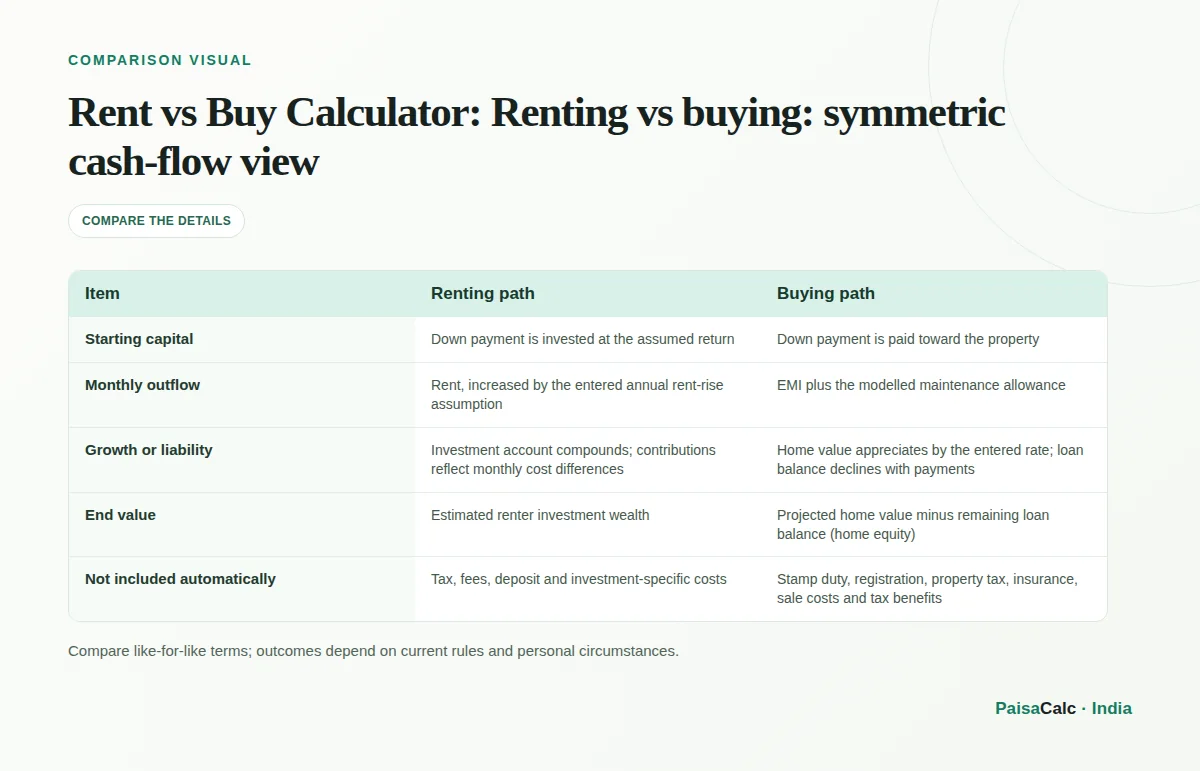
| Item | Renting path | Buying path |
|---|---|---|
| Starting capital | Down payment is invested at the assumed return | Down payment is paid toward the property |
| Monthly outflow | Rent, increased by the entered annual rent-rise assumption | EMI plus the modelled maintenance allowance |
| Growth or liability | Investment account compounds; contributions reflect monthly cost differences | Home value appreciates by the entered rate; loan balance declines with payments |
| End value | Estimated renter investment wealth | Projected home value minus remaining loan balance (home equity) |
| Not included automatically | Tax, fees, deposit and investment-specific costs | Stamp duty, registration, property tax, insurance, sale costs and tax benefits |
Not necessarily. The outcome depends on rent, price, down payment, financing, maintenance, appreciation, investment returns, and how long the household stays. Compare the same quality and location of housing.
No. These purchase costs can be significant in India and vary by state and transaction. Obtain current estimates for the property and add them to a personalised scenario.
There is no guaranteed rate. Use a conservative assumption appropriate to the investment’s risk, liquidity, fees, and tax treatment; test a range rather than presenting one return as certain.
No. Tax treatment depends on the tax regime, property use, ownership, loan and current law. The comparison is a simplified pre-tax estimate, so verify any claim with the Income Tax Department or a qualified adviser.
If renting costs less and the renter invests the down payment and monthly savings consistently, those investments may grow faster than the buyer’s equity in a given scenario. The result is sensitive to return and discipline assumptions.
Enter a reasonable comparison assumption, then test higher and lower rates. A floating rate can reset, so the actual EMI or tenure may change; read the lender’s reset and spread terms before borrowing.
No. Enter how long you expect to own or occupy the home. A five-year horizon and a twenty-year horizon answer different questions, especially when buying and selling costs are considered.
The input is an annual percentage of the home price used as a simplified owner-cost allowance. It does not automatically cover every property tax, society charge, insurance premium, renovation, or major repair.
You can, but the result becomes less meaningful. Try to match size, locality, condition, amenities, commute and parking; otherwise the financial difference may be reflecting a different housing service.
No. It compares estimated financial wealth only. Stable tenure, control over alterations, family needs, commute, job mobility and the stress of moving should be considered alongside the numerical output.
Use primary and provider references to verify current rules, rates, and product terms.
Supports the caution that a home-loan rate, especially a floating rate, may not remain unchanged through the full tenure and that borrowers should check loan terms.
Supports the explanation that floating-rate EMI loans can be affected by interest-rate resets and that borrowers should review reset choices and communication.
Supports the suggestion to consider RERA information and perform property due diligence; it is not used to state a project-specific legal conclusion.
Supports the warning that home-loan tax treatment depends on the applicable tax regime and circumstances, so tax benefits are excluded from this simplified comparison.
TAKE A 30-SECOND BREAK
Three questions to help the key ideas stick.