Test an ending value 20% higher
Ending value (₹): ₹1,80,000 → ₹2,16,000
Compound annual growth12.47%16.65%
INVESTING · FREE TOOL
Measure the smoothed annual growth rate between two values. Adjust the assumptions and see how the result changes.
Interactive tool
Change the inputs to compare scenarios. Your values stay in this browser.
QUICK TAKEAWAY
This is a result from the assumptions currently entered. Compare a few alternatives below before drawing conclusions.
BASED ON YOUR INPUTS
With these inputs, compound annual growth is 12.47%.
For context, total change is ₹80,000.
Test an ending value 20% higher changes compound annual growth from 12.47% to 16.65% in this model.
TRY A DIFFERENT ASSUMPTION
Each card recalculates from the inputs above.
Ending value (₹): ₹1,80,000 → ₹2,16,000
Period (years): 5 → 6
A MINI CHALLENGE
Test a value here first. Your calculator changes only if you apply it.
Challenge reached: 10% annualised growth.
Calculations run locally. Browser activity remembers calculator visits and quiz scores only—not financial inputs or results. Share links include values only when you choose to share them.
PaisaCalc guide · India

This CAGR calculator measures the compound annual growth rate between a starting value and an ending value. Enter both amounts in Indian rupees and the elapsed period in years. It returns the single annualised percentage that would connect the two values if growth compounded at a constant rate.
For example, ₹1,00,000 becoming ₹1,80,000 over five years gives about 12.47% a year. The smooth year-by-year path is only an illustration, not a record of actual NAVs or prices. Use positive values and a meaningful period; the result does not separately estimate tax, fees, dividends or future returns.
A rupee gain does not show how quickly money grew: ₹50,000 earned in two years differs from the same gain in ten years. CAGR puts unequal periods on a common annual basis, helping an Indian investor make a first comparison of a fund, share holding, savings balance or business turnover.
It also keeps the question narrow. CAGR describes the rate connecting two endpoints; it does not show risk, volatility or whether the rate can continue. Review dates, cash flows, costs, taxes and inflation separately before using it for a decision.
The calculator divides the ending value by the starting value, finds the yearly root for the stated period, subtracts one, and converts the result to a percentage. With ₹1,00,000, ₹1,80,000 and five years, the multiple is 1.8 and the fifth-root calculation gives about 12.47%.
Enter matching units: rupees for both values and years for the period. A fractional period such as 0.5 can be used when it represents elapsed time sensibly. Do not enter 60 monthly records as 60 years; convert the period to years. Intermediate chart values are a smooth equivalent path.
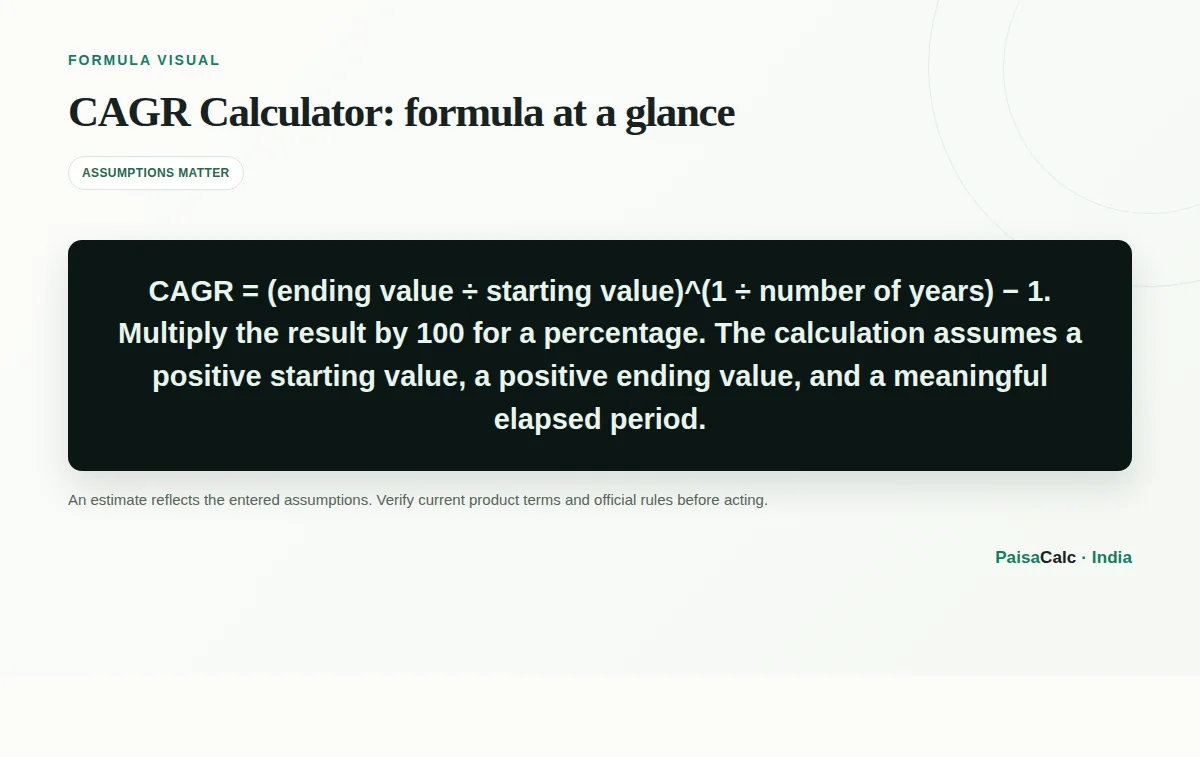
The formula is CAGR = (ending value ÷ starting value)^(1 ÷ number of years) − 1. If V₀ is the positive start, Vₙ the positive end and n the positive number of years, CAGR = (Vₙ ÷ V₀)^(1/n) − 1; multiply by 100 for a percentage.
A lower ending value produces a negative CAGR: ₹1,00,000 falling to ₹80,000 over five years is about −4.36% annually, not a 20% annual loss. The two-value formula ignores interim deposits, withdrawals, separately received dividends, brokerage, expense ratios, exit loads and taxes.
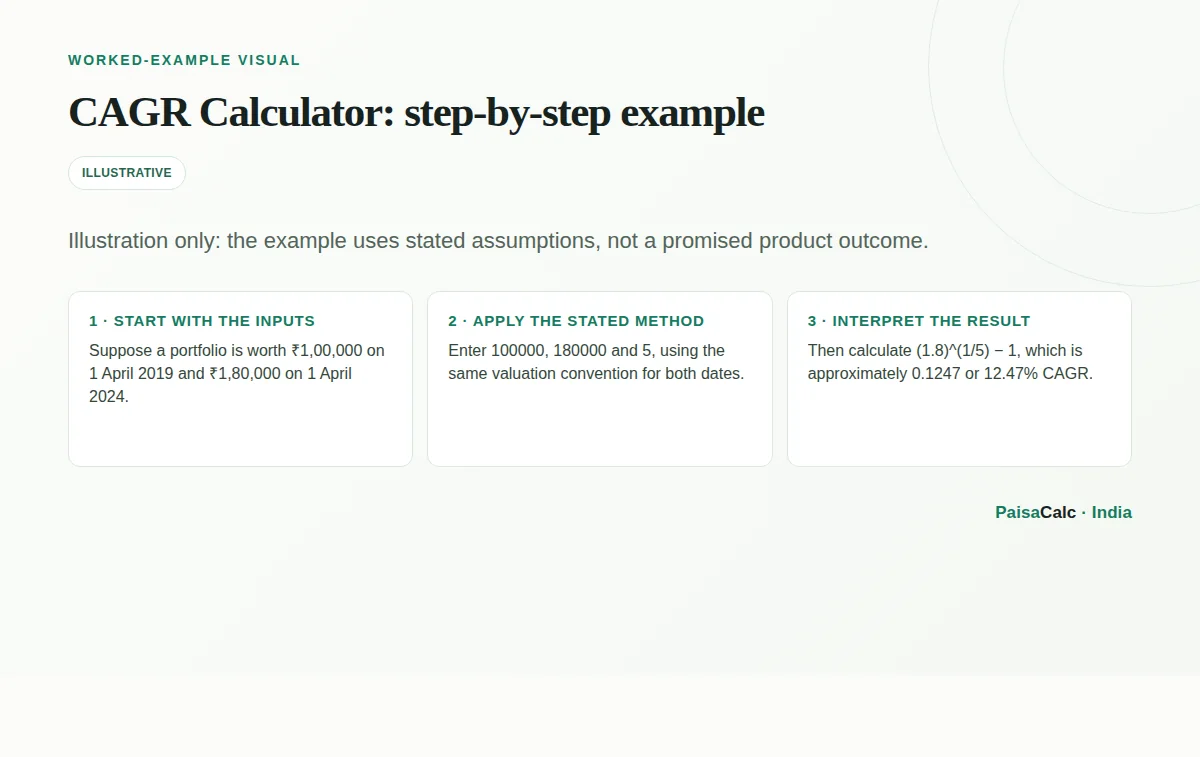
Suppose a portfolio is worth ₹1,00,000 on 1 April 2019 and ₹1,80,000 on 1 April 2024. Enter 100000, 180000 and 5, using the same valuation convention for both dates. Then calculate (1.8)^(1/5) − 1, which is approximately 0.1247 or 12.47% CAGR.
A constant-rate illustration is roughly ₹1,12,470 after year one and ₹1,26,495 after year two. Those are not proof of the portfolio’s actual path. Check statements for falls, additions, withdrawals and distributions before comparing the result with another investment.
A mutual-fund investor can compare two schemes over matching dates and return conventions; a direct-equity investor can review a simple holding with no intervening cash flow. A fund’s published CAGR is not automatically the personal return of an investor who bought units at different times.
A business owner can annualise turnover or profit growth, and a household can review a lump-sum savings balance between statements. For an education or retirement goal, pair historical CAGR with inflation and contributions. Monthly SIPs, transfers and withdrawals need dated cash-flow analysis rather than this two-endpoint shortcut.
CAGR compresses a multi-year change into one understandable number for an annual review, dashboard or preliminary comparison. It avoids comparing total returns across unequal periods without annualising them and is easy to reproduce in a spreadsheet.
Compounding matters: a 100% gain over four years is not 25% compounded annually; its equivalent CAGR is about 18.92%. The calculation is transparent, but it remains an estimate of the supplied endpoints, not a recommendation or guaranteed rate.
Do not confuse CAGR with an arithmetic average of yearly returns. CAGR hides the order and size of interim gains and losses, so inspect annual returns and drawdowns when volatility matters. Do not mix INR with USD, or a price-only value with a total-return value that includes dividends.
A frequent household error is applying CAGR to a monthly SIP or an account with withdrawals. The final balance includes money added at different times, so it is not all growth on the first contribution. Short periods can also create extreme annualised figures from small date or price changes.
Record valuation dates, statement values, contributions, withdrawals and distributions. For a lump sum, compare like-for-like values; for recurring contributions, use a cash-flow-aware measure and keep CAGR as a descriptive comparison. Compare the same asset type, dates, currency and income treatment.
Inflation changes purchasing power, so test a goal in today’s rupees and consider a range rather than one precise rate. Historical growth is not a promise. Keep an emergency reserve and do not increase risk merely to chase a past CAGR.
CAGR is path-independent: two portfolios with the same start, end and period have the same CAGR even if one suffered a steep drawdown. Add annual returns, drawdown and recovery time when assessing risk. A smooth calculator chart must not be mistaken for actual NAV history.
The result is sensitive to endpoint selection, such as a market peak or trough. Use consistent dates and, where useful, rolling periods. For multiple deposits or withdrawals, XIRR generally fits personal performance better. Keep nominal CAGR, inflation-adjusted purchasing power and after-cost outcomes separate.
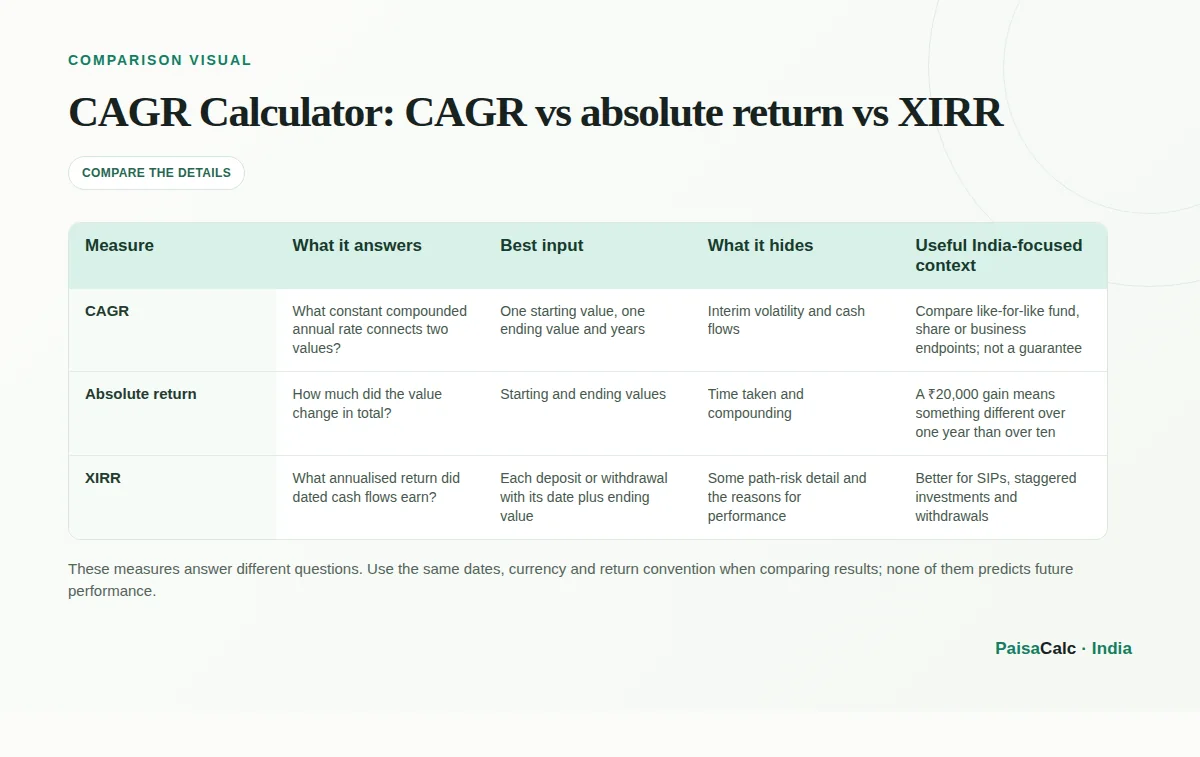
| Measure | What it answers | Best input | What it hides | Useful India-focused context |
|---|---|---|---|---|
| CAGR | What constant compounded annual rate connects two values? | One starting value, one ending value and years | Interim volatility and cash flows | Compare like-for-like fund, share or business endpoints; not a guarantee |
| Absolute return | How much did the value change in total? | Starting and ending values | Time taken and compounding | A ₹20,000 gain means something different over one year than over ten |
| XIRR | What annualised return did dated cash flows earn? | Each deposit or withdrawal with its date plus ending value | Some path-risk detail and the reasons for performance | Better for SIPs, staggered investments and withdrawals |
These measures answer different questions. Use the same dates, currency and return convention when comparing results; none of them predicts future performance.
No. CAGR is the constant compounded rate between two endpoints. An arithmetic average of yearly returns does not account for compounding in the same way and can give a different result.
No. It compresses the full period into one rate and hides intermediate movement. Review annual returns, drawdown and a dated value series to understand volatility.
Yes, when the elapsed period is positive and expressed consistently in years. Short-period annualisation can be very sensitive to small price or date differences, so interpret it carefully.
No. CAGR describes the supplied past or scenario endpoints. It does not guarantee that the same rate will continue or indicate the risk of an investment.
Usually not for personal cash-flow performance. With dated contributions, a money-weighted measure such as XIRR better reflects when each amount was invested.
Enter a positive starting value, a positive ending value and the elapsed period in years. Use the same currency and valuation basis for both values; the calculator is not a tax or fee estimator.
It means the ending value is below the starting value over the stated period. The percentage is the constant compounded annual decline that would connect those endpoints.
Only if they are already reflected in the values you enter. Decide whether the endpoints are gross, net, or total-return values and use the same convention at both dates.
The dates, NAVs, dividend treatment, expenses, rounding and return convention may differ. Check the factsheet’s methodology and compare matching dates and values before drawing a conclusion.
CAGR connects two values over one period and ignores interim cash flows. XIRR uses dated deposits and withdrawals, so it is generally more suitable for an investor’s irregular cash-flow return.
Use primary and provider references to verify current rules, rates, and product terms.
CAGR is a compounded annualised measure for periods over one year, and past performance is not a guarantee of future performance.
Inflation affects purchasing power, so a nominal growth rate should be considered alongside future spending needs.
Investment comparisons should be made with awareness of risk, disclosures and the distinction between historical information and a promise of future returns.
TAKE A 30-SECOND BREAK
Three questions to help the key ideas stick.