Reduce the largest entered spending category by 10%
Housing / rent (₹): ₹25,000 → ₹22,500
Monthly expenses₹81,000₹78,500
PLANNING · FREE TOOL
Compare monthly income, spending, and savings capacity. Adjust the assumptions and see how the result changes.
Interactive tool
Change the inputs to compare scenarios. Your values stay in this browser.
QUICK TAKEAWAY
This is a result from the assumptions currently entered. Compare a few alternatives below before drawing conclusions.
BASED ON YOUR INPUTS
With these inputs, monthly expenses is ₹81,000.
Monthly surplus / gap shows a modeled surplus of ₹19,000.
Reduce the largest entered spending category by 10% changes monthly expenses from ₹81,000 to ₹78,500 in this model.
TRY A DIFFERENT ASSUMPTION
Each card recalculates from the inputs above.
Housing / rent (₹): ₹25,000 → ₹22,500
Monthly take-home income (₹): ₹1,00,000 → ₹1,10,000
A MINI CHALLENGE
Test a value here first. Your calculator changes only if you apply it.
Keep experimenting to test about ₹83,334 monthly surplus (₹10 lakh/year).
Calculations run locally. Browser activity remembers calculator visits and quiz scores only—not financial inputs or results. Share links include values only when you choose to share them.
PaisaCalc guide · India

The PaisaCalc Budget Calculator is a monthly cash-flow snapshot. Enter take-home income and the amounts you normally spend on housing, food, transport, utilities and phone, debt EMIs, health and insurance, and other spending. The tool adds the entered categories, subtracts them from income, and shows an estimated surplus or shortfall.
It also displays the savings rate and each category's share of income. Use rupee amounts for a typical month, not annual salary or gross cost-to-company figures. The result is an estimate based only on what you enter; it does not connect to bank accounts, judge your choices, or predict investment returns.
A budget turns a vague feeling that money is disappearing into a visible list of commitments. For an Indian household, rent or a home-loan EMI, groceries, school-related costs, commuting, family support, medical spending, and digital subscriptions can all compete for the same monthly cash. Seeing their total makes trade-offs easier to discuss.
The calculator can reveal whether a planned savings transfer is supported by actual cash flow. A positive surplus is not automatically available for investing if annual premiums, repairs, travel, or festival spending were omitted. A negative result is a prompt to check the data and make a sustainable plan, not a financial diagnosis.
Start with the amount deposited or otherwise available to spend each month after payroll deductions. Add each recurring category once. Housing can include rent or a regular home payment; food can include groceries and routine meals; transport can include fuel, fares, or a commute pass. Put costs that do not fit the listed categories in Other spending.
The tool totals the seven expense inputs and compares that total with income. It then divides the surplus by income for the savings rate and divides each category by income for its category share. If expenses are higher than income, the surplus is negative and represents a shortfall. Zero income is not a useful input for percentage outputs, so use a real positive take-home figure.
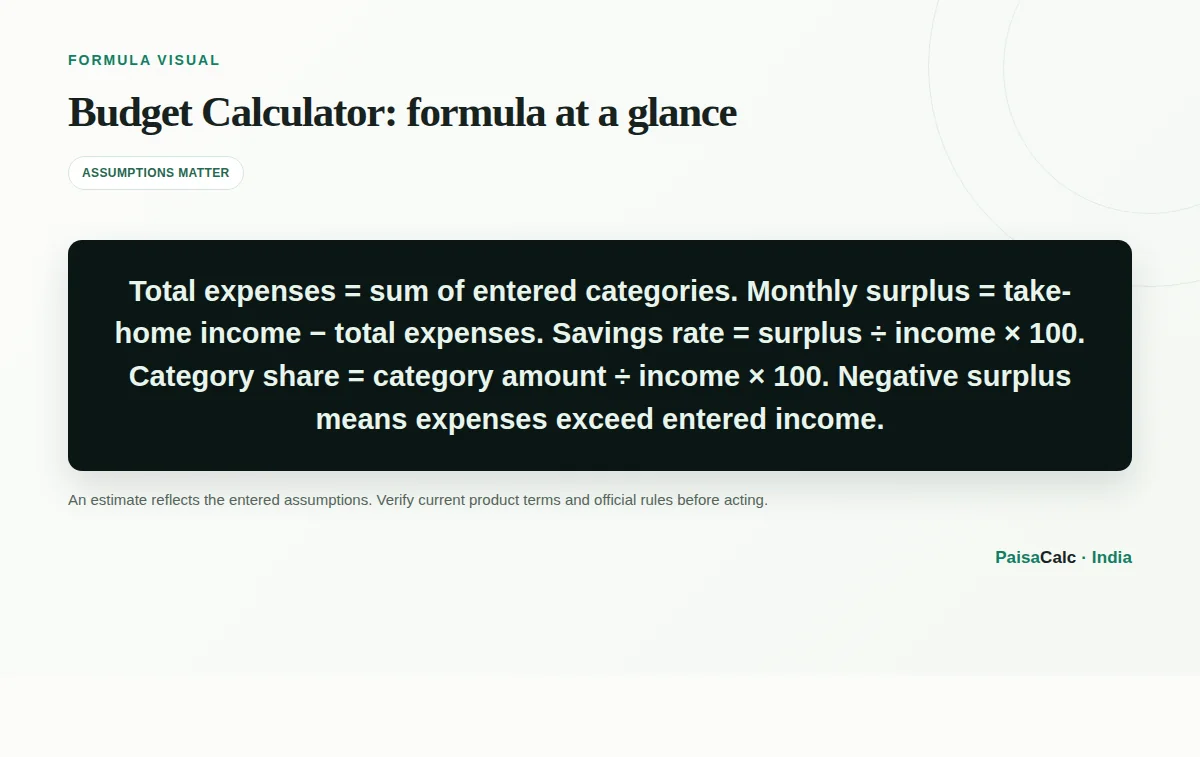
The core calculation is: Total expenses = housing + food + transport + utilities and phone + debt EMIs + health and insurance + other spending. Monthly surplus = take-home income − total expenses. These are simple arithmetic estimates, so the answer changes when a category estimate changes.
Savings rate = monthly surplus ÷ take-home income × 100. Category share = category amount ÷ take-home income × 100. A category share describes the entered cash commitment; it is not a recommended limit. For example, ₹25,000 housing on ₹1,00,000 take-home income is a 25% category share. If a bill is annual, first divide it by 12 and include the monthly equivalent.
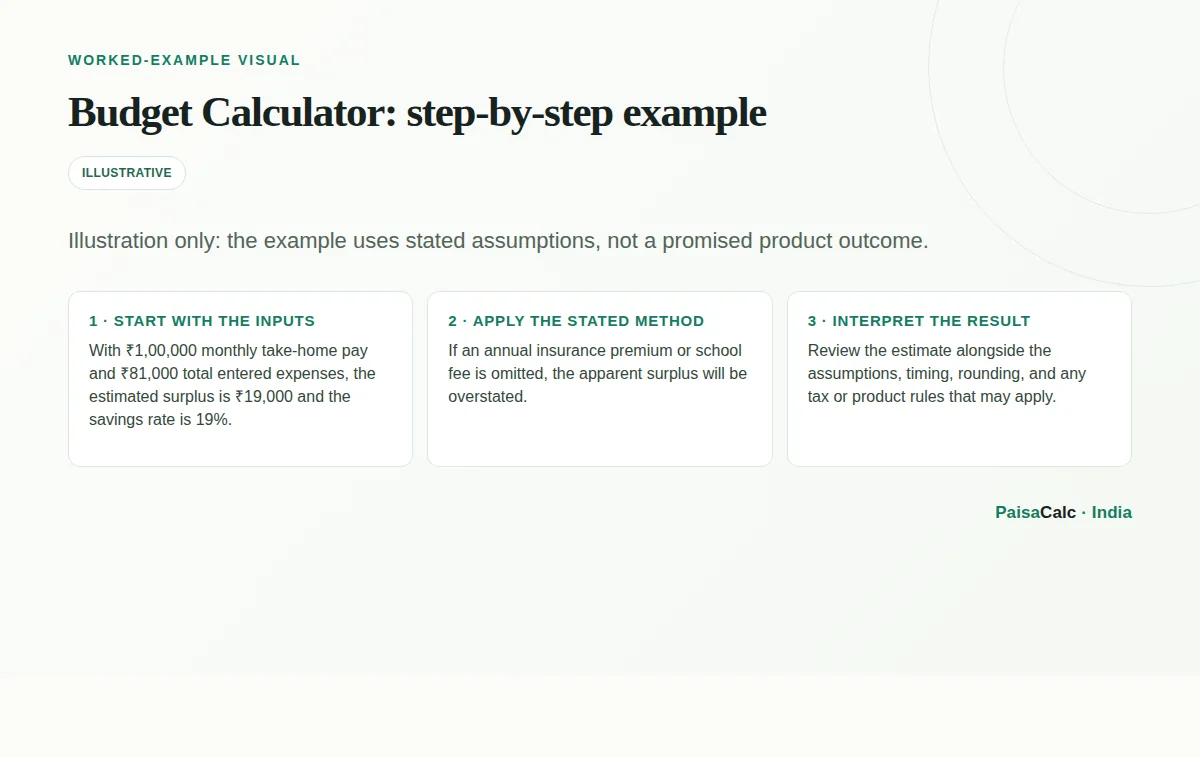
Suppose a household receives ₹1,00,000 per month after deductions. It enters ₹25,000 for housing, ₹15,000 for food, ₹8,000 for transport, ₹6,000 for utilities and phone, ₹12,000 for EMIs, ₹5,000 for health and insurance, and ₹10,000 for other spending. The entered expenses total ₹81,000.
The estimated surplus is ₹1,00,000 − ₹81,000 = ₹19,000, so the savings rate is 19%. Housing represents 25% of income and EMIs represent 12%. If a ₹24,000 annual insurance premium is missing, adding its ₹2,000 monthly equivalent raises expenses to ₹83,000 and reduces the estimated surplus to ₹17,000. This illustrates why complete inputs matter.
A salaried renter can test whether a proposed rent increase still leaves room for an emergency-fund contribution. A couple can enter their combined take-home income and agreed household costs, then discuss personal spending that is currently hidden in Other. A self-employed person can use a conservative average monthly draw, while remembering that irregular business receipts are not the same as dependable household income.
The tool is also useful before taking a car loan, changing jobs, or moving cities. Add the expected EMI or higher commute cost and compare the new result with the current month. For annual school fees, insurance, maintenance, or festival travel, create a monthly sinking-fund amount rather than waiting for the bill to appear.
The main benefit is clarity: one screen shows total commitments, remaining cash, savings rate, and the largest categories. That makes a monthly review quicker than scanning several payment histories. Category shares can also help distinguish a structural cost, such as rent or EMI, from flexible spending that may be adjusted without disrupting essential needs.
It provides a neutral starting point for goals. A surplus can be assigned to an emergency reserve, a near-term purchase, debt prepayment, or long-term investing after appropriate research. If there is a shortfall, the category view helps prioritise essential bills before optional reductions. The estimate remains a planning aid, not a promise of future savings.
Do not compare gross salary with expenses paid from net salary. Do not count an EMI once under debt and again under housing or Other. Avoid entering a credit-card payment while also entering every purchase if that would count the same spending twice. Likewise, a transfer to savings is not consumption; decide whether you want to track it as a goal after calculating the cash-flow surplus.
Averages can hide seasonal pressure. Include monthly equivalents for premiums, tuition, repairs, annual memberships, travel, and festivals, or maintain a separate sinking-fund list. Check cash and account records for a few months instead of relying on memory. If income varies, use a cautious normal month and test a lower-income scenario rather than assuming the best month repeats.
Review the result on a regular day each month and label every category consistently. Keep essential bills, debt obligations, and protection costs visible before trimming discretionary items. Set one concrete next action, such as automating a realistic reserve contribution after payday or cancelling an unused subscription. Re-run the estimate when rent, EMI, household size, or work location changes.
The calculator can support either a percentage-based method or a detailed zero-based plan. In a percentage method, broad buckets provide a quick guardrail; in a zero-based plan, every rupee of expected income is assigned to spending, saving, or a goal. Neither method is universally correct. Your dependants, debt, irregular income, housing market, and priorities determine what is workable.
Use scenario testing instead of treating one result as a verdict. Duplicate the monthly estimate for a rent increase, an EMI ending, a lower-income month, or a medical-cost buffer. A small reduction in several flexible categories may be more realistic than an extreme cut in one category, while a large fixed obligation may require a bigger decision.
Separate cash-flow surplus from net-worth progress. Loan principal repayment can reduce a liability even though the EMI is a cash outflow, while an investment may fluctuate and should not be assumed to produce a fixed return. Pair this snapshot with an emergency-fund target and a balance-sheet review. Refresh annual equivalents and check that the sum of category shares is sensible; rounding may make displayed percentages differ slightly from 100%.
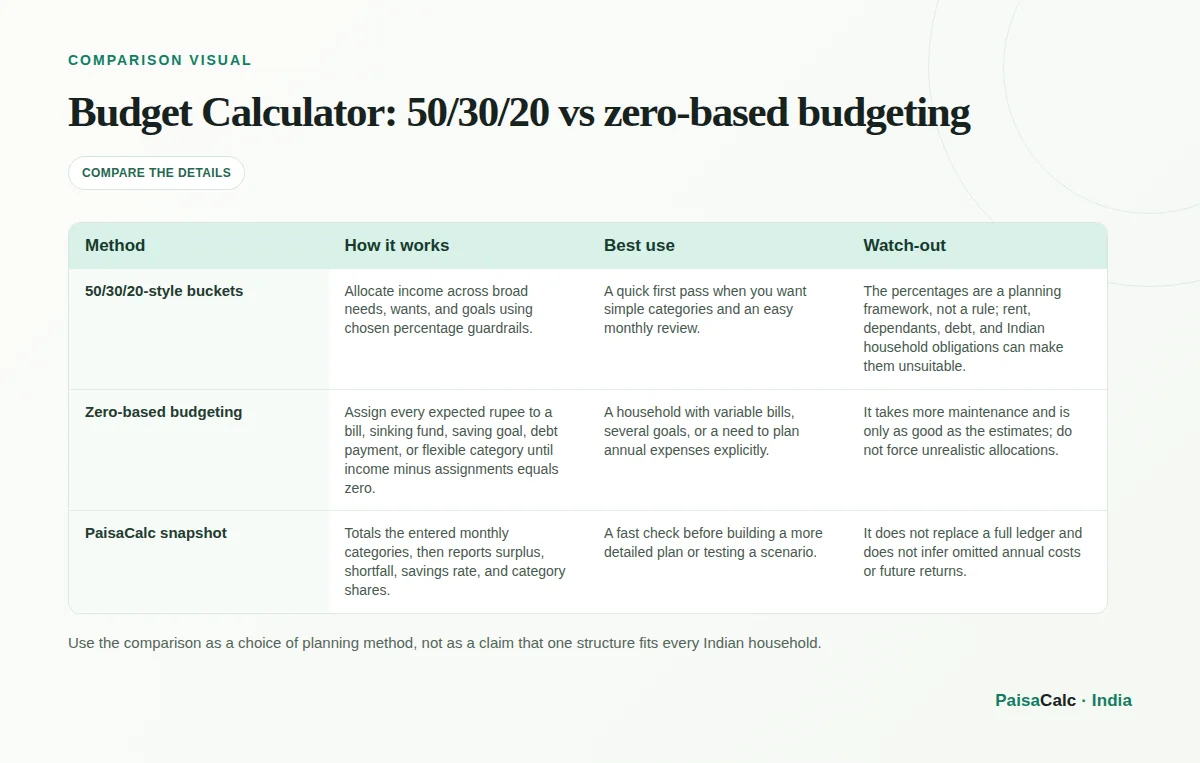
| Method | How it works | Best use | Watch-out |
|---|---|---|---|
| 50/30/20-style buckets | Allocate income across broad needs, wants, and goals using chosen percentage guardrails. | A quick first pass when you want simple categories and an easy monthly review. | The percentages are a planning framework, not a rule; rent, dependants, debt, and Indian household obligations can make them unsuitable. |
| Zero-based budgeting | Assign every expected rupee to a bill, sinking fund, saving goal, debt payment, or flexible category until income minus assignments equals zero. | A household with variable bills, several goals, or a need to plan annual expenses explicitly. | It takes more maintenance and is only as good as the estimates; do not force unrealistic allocations. |
| PaisaCalc snapshot | Totals the entered monthly categories, then reports surplus, shortfall, savings rate, and category shares. | A fast check before building a more detailed plan or testing a scenario. | It does not replace a full ledger and does not infer omitted annual costs or future returns. |
Use the comparison as a choice of planning method, not as a claim that one structure fits every Indian household.
Enter monthly take-home income: the amount actually available after payroll deductions. Comparing it with cash expenses keeps the surplus estimate on the same basis.
Divide an expected annual bill by 12 and add that monthly equivalent to a suitable category, or maintain a separate sinking-fund line. This avoids overstating the available surplus.
It means the entered monthly expenses exceed entered take-home income. First check for missing income, duplicate entries, and annual costs; then plan realistic changes to close the gap.
No. A useful savings rate depends on income, dependants, debt, housing, goals, and irregular costs. Track your own trend rather than treating a percentage as a universal score.
Calculate the cash-flow surplus before assigning it to savings goals. You can then record planned savings separately so a transfer is not mistaken for consumption or counted twice.
Yes, but use a cautious monthly income estimate, such as a sustainable normal month, and test a lower-income scenario. Do not build fixed commitments around an unusually high receipt.
Use it for recurring or averaged items that do not fit the listed categories, such as household help, subscriptions, family transfers, or personal spending. Review it periodically so important costs do not stay hidden.
No. It uses the take-home income you enter and performs cash-flow arithmetic. It does not calculate income tax, forecast returns, or apply a statutory savings rule.
No. The calculator does not connect to bank accounts or create a budget account. Treat the output as an on-page estimate and save your own records only if you choose.
Review it monthly while building the habit and whenever income, rent, EMIs, household size, or recurring bills change. Compare with actual spending over several months to improve estimates.
Use primary and provider references to verify current rules, rates, and product terms.
Supports the explanation that documenting income and expenses helps a person understand the financial position, control spending, and plan saving.
Supports practical guidance to list income and expense categories and review a budget rather than relying on memory.
Provides the primary Indian financial-literacy context for planning, responsible money management, and using estimates cautiously.
TAKE A 30-SECOND BREAK
Three questions to help the key ideas stick.