Raise the monthly contribution by 20%
Monthly contribution (₹): ₹10,000 → ₹12,000
Projected corpus₹1,12,11,219₹1,34,53,463
RETIREMENT · FREE TOOL
Estimate National Pension System corpus and annuity income. Adjust the assumptions and see how the result changes.
Interactive tool
Change the inputs to compare scenarios. Your values stay in this browser.
Market-linked projection. Annuity rates, NPS exit rules, charges and tax are not fetched or verified here.
QUICK TAKEAWAY
This is a result from the assumptions currently entered. Compare a few alternatives below before drawing conclusions.
BASED ON YOUR INPUTS
With these inputs, projected corpus is ₹1,12,11,219.
The projected amount is ₹82,11,219 above modeled contributions or deposits; this is not a guaranteed return.
Raise the monthly contribution by 20% changes projected corpus from ₹1,12,11,219 to ₹1,34,53,463 in this model.
Model note: Market-linked projection. Annuity rates, NPS exit rules, charges and tax are not fetched or verified here.
TRY A DIFFERENT ASSUMPTION
Each card recalculates from the inputs above.
Monthly contribution (₹): ₹10,000 → ₹12,000
Years to invest: 25 → 30
A MINI CHALLENGE
Test a value here first. Your calculator changes only if you apply it.
Challenge reached: ₹1 crore.
Calculations run locally. Browser activity remembers calculator visits and quiz scores only—not financial inputs or results. Share links include values only when you choose to share them.
PaisaCalc guide · India

This NPS calculator gives an educational projection of how a regular monthly contribution could grow in the National Pension System over a chosen period. Enter the monthly amount, assumed annual return, years to invest, annuity allocation and assumed annual annuity rate. The output separates contributions, estimated growth, projected corpus, annuity amount, residual lump-sum amount and indicative monthly pension.
NPS is a regulated, defined-contribution retirement framework, and NPS Trust describes it as market-linked. This tool does not open an account, quote a provider, decide eligibility or determine exit and tax treatment. Use rupees, years and percentages within the displayed input ranges; the default 40% allocation and 6% rate are scenarios, not current rules or a live quote.
Retirement planning is sensitive to time and contribution discipline. Seeing only a final corpus can hide how much came from deposits and how much depends on a return assumption. This calculator makes those components visible, helping an Indian saver judge whether a proposed monthly NPS contribution is meaningful for a long-term goal.
The annuity split matters because a corpus is not the same as monthly income. Only the selected annuity portion is multiplied by the annual annuity rate and divided by 12. Compare that estimate with household expenses, inflation and other income, then take conservative, middle and optimistic scenarios to an adviser rather than relying on one attractive number.
The model assumes the same contribution at the end of each month and converts the selected annual return into a smooth monthly equivalent. It compounds that contribution for the chosen number of months, applies the annuity allocation to the projected corpus, and labels the remainder as a residual lump-sum portion for illustration.
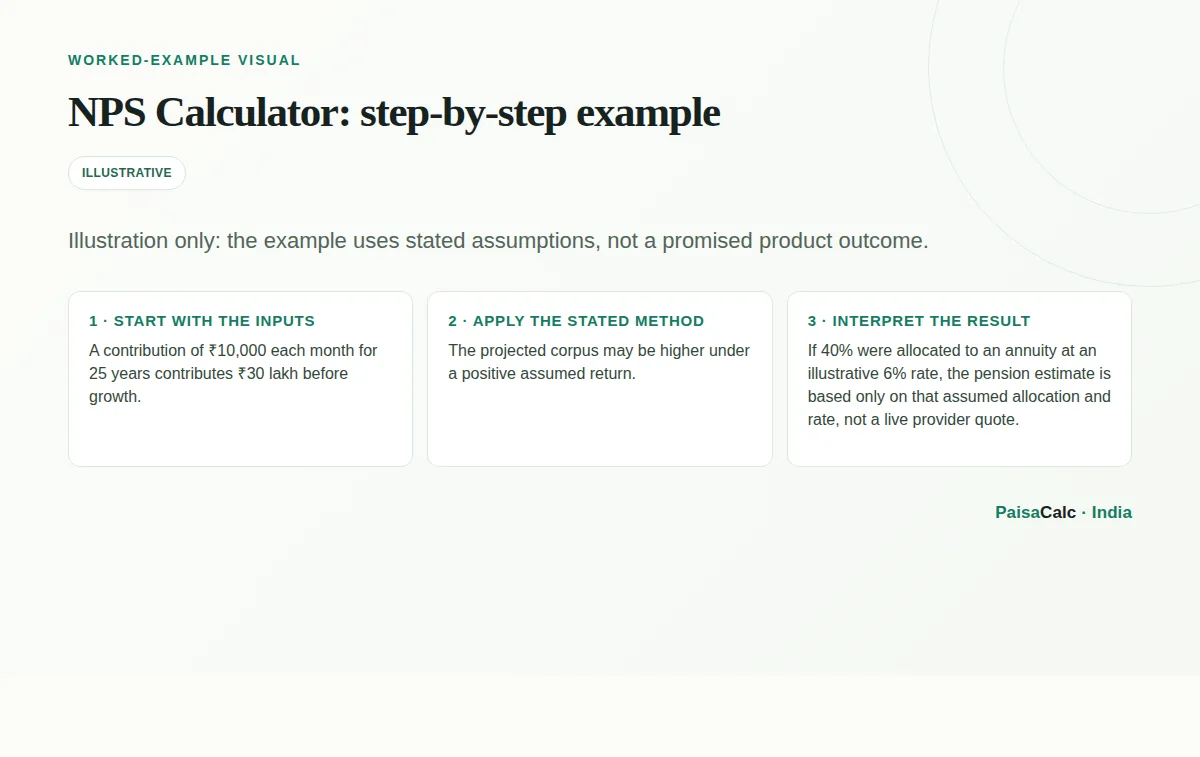
For example, ₹10,000 per month for 25 years means 300 deposits and ₹30,00,000 of contributions before growth. The model does not simulate changing market prices, missed deposits, charges, inflation, tax, withdrawal eligibility or a particular annuity product, so actual values and pension offers can differ materially.
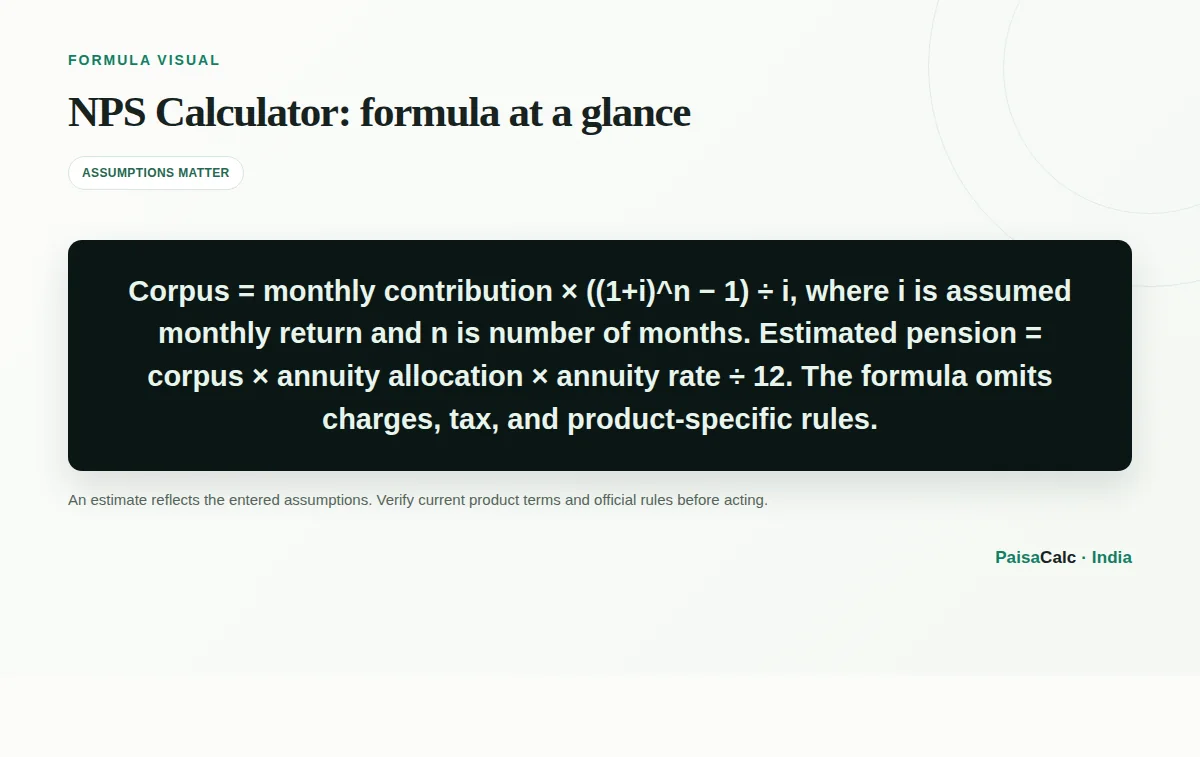
Let P be the monthly contribution, i the assumed monthly return and n the number of monthly deposits. The projected corpus is P × ((1 + i)^n − 1) ÷ i, where i is derived from the selected annual return and n equals years to invest × 12. This is the future value of regular end-of-month contributions.
At 0% return, the model uses P × n instead of dividing by zero. Estimated annuity amount is corpus × allocation ÷ 100, and indicative monthly pension is annuity amount × annuity rate ÷ 100 ÷ 12. The equations omit charges, volatility, timing differences, tax and product terms; a 6% input is not a promised ASP rate or survivor-benefit guarantee.
Suppose Asha enters ₹10,000 monthly, 9% assumed annual return, 25 years, 40% annuity allocation and 6% assumed annuity rate. The calculator first counts 300 deposits, so contributions alone are ₹30,00,000. It then compounds the deposits using the selected smooth assumption.
Next, 40% of the projected corpus becomes the illustrative annuity amount and 60% becomes the residual portion. Applying 6% per year and dividing by 12 gives the indicative pension. Asha should test lower and higher returns, different contributions and a shorter period, and must not call the result guaranteed or a provider quote.
A salaried employee can test a contribution increase after a promotion by comparing, for example, ₹8,000, ₹12,000 and ₹15,000 per month. A self-employed professional can model the amount that remains affordable through uneven income, then treat occasional extra deposits as a separate scenario because this tool assumes equal monthly payments.
A couple can compare the modelled annuity income with household expenses and discuss survivor needs. Annuity choices and prices vary by provider and date, so the calculator frames questions rather than selecting a plan. Someone near retirement can also compare it with EPF, other savings and expected expenses.
The main benefit is a simple decomposition of a long-term goal: cash paid in, illustrative growth, corpus, annuity allocation and residual amount. That breakdown helps a beginner see why starting earlier can matter even when the first monthly contribution feels small.
You can hold the period constant and vary contributions, or hold contributions constant and test return assumptions and 20%, 40% and 60% allocations. These scenarios support an Indian household budget review, but the result remains a range. Verify current information with PFRDA, NPS Trust, the CRA or a qualified adviser.
Do not read the assumed return as an assured NPS rate. NPS investments are market-linked and actual returns can be above or below a smooth projection. Do not use an old annuity illustration as a current quote: provider, option, age and purchase conditions affect income.
Do not confuse the annuity allocation with a universal withdrawal rule. Current exit conditions depend on subscriber category and rules in force. Other mistakes include forgetting inflation, assuming contributions rise automatically, ignoring charges and counting the whole corpus as spendable monthly income.
Begin with a contribution that can continue through ordinary income fluctuations. Run low, middle and high return cases instead of choosing only the highest number, and compare the future nominal pension separately with an inflation-adjusted budget. This calculator does not adjust for rising prices.
Keep NPS inside a wider plan covering essential expenses, health care, EPF or other provident savings, investments and an emergency fund. Confirm current rules and charges through PFRDA or NPS Trust, and obtain an actual annuity illustration when relevant. Revisit the plan after a salary, family or career change.
The projection is sensitive to duration because each additional month can receive growth for a different length of time. Compare ₹10,000 for 15, 25 and 35 years, then compare extra contributions with the corpus change. This illustrates compounding without claiming that markets follow a fixed path.
Test the annuity allocation separately from return. A larger allocation raises modelled monthly income but reduces the residual amount; it does not automatically improve the household outcome. Keep an assumptions log with date, contribution, return, years, allocation and rate, and compare the broad direction with statements and regulated disclosures.
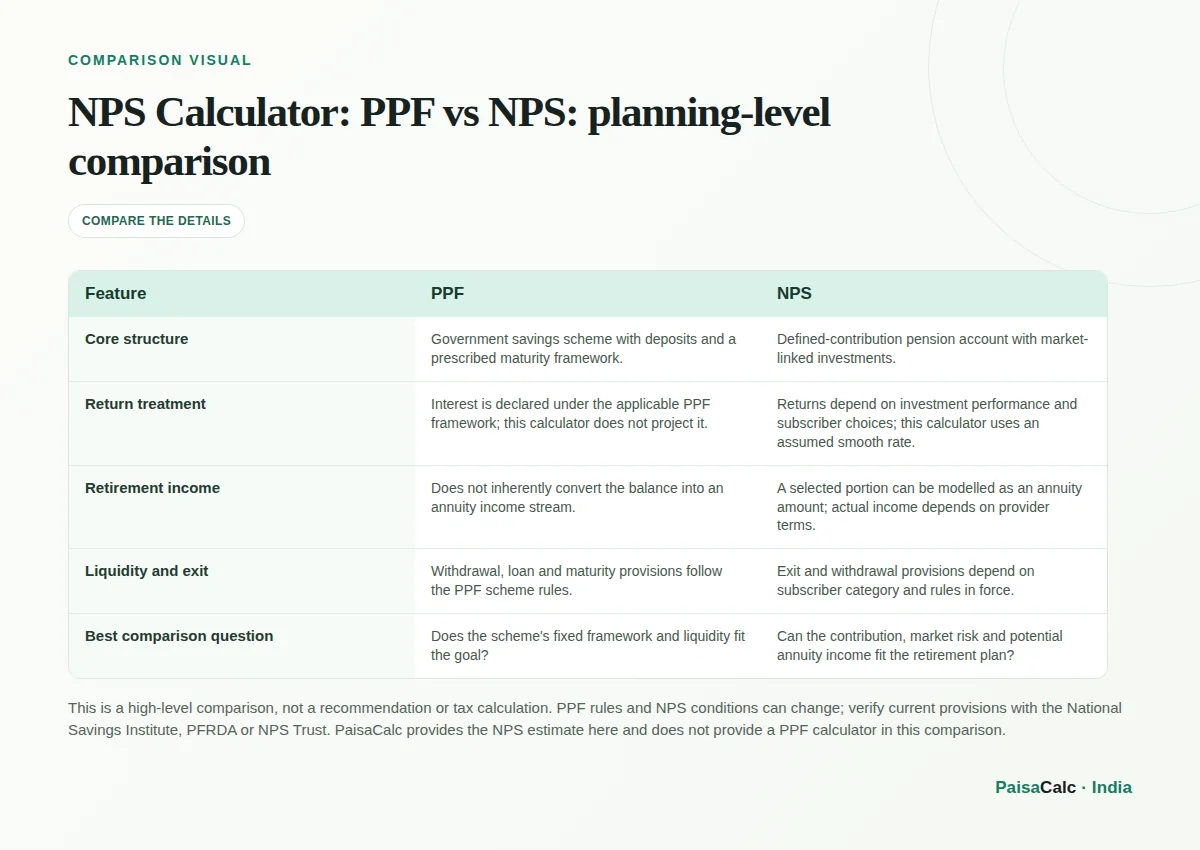
| Feature | PPF | NPS |
|---|---|---|
| Core structure | Government savings scheme with deposits and a prescribed maturity framework. | Defined-contribution pension account with market-linked investments. |
| Return treatment | Interest is declared under the applicable PPF framework; this calculator does not project it. | Returns depend on investment performance and subscriber choices; this calculator uses an assumed smooth rate. |
| Retirement income | Does not inherently convert the balance into an annuity income stream. | A selected portion can be modelled as an annuity amount; actual income depends on provider terms. |
| Liquidity and exit | Withdrawal, loan and maturity provisions follow the PPF scheme rules. | Exit and withdrawal provisions depend on subscriber category and rules in force. |
| Best comparison question | Does the scheme's fixed framework and liquidity fit the goal? | Can the contribution, market risk and potential annuity income fit the retirement plan? |
This is a high-level comparison, not a recommendation or tax calculation. PPF rules and NPS conditions can change; verify current provisions with the National Savings Institute, PFRDA or NPS Trust. PaisaCalc provides the NPS estimate here and does not provide a PPF calculator in this comparison.
No. NPS investments are market-linked. This calculator assumes a smooth return, so the actual account value may be higher or lower and will not follow the projection each month.
No. The entered rate is a scenario assumption. Actual annuity quotes, options and survivor benefits depend on the provider, plan terms and circumstances at the time of purchase.
No. It projects contributions, growth and an illustrative annuity income only. Tax treatment depends on the subscriber and rules in force, so check current official guidance rather than estimating tax from this page.
This calculator cannot determine that. Exit and withdrawal conditions depend on subscriber category and current rules. Confirm eligibility and permitted options with PFRDA, NPS Trust, the CRA or a qualified adviser.
Only the selected annuity portion is used for the pension estimate, and the annuity rate is annual before being divided by 12. A lower allocation or rate will reduce the displayed monthly amount.
The model treats it as no investment growth and shows monthly contribution multiplied by the number of months. This avoids dividing by zero in the ordinary compounding formula; it is not a prediction of actual NPS performance.
No. The rupee figures are future nominal estimates under the selected assumptions. Compare them separately with an inflation-adjusted retirement budget to understand future purchasing power.
No. The formula is a simplified contribution-and-growth model and omits charges. Review applicable charges and account statements when making a real contribution decision.
The calculator assumes an equal contribution every month. If your income varies, use a conservative regular amount and treat any additional deposits as a separate scenario rather than calling the result an exact forecast.
A higher allocation increases the pension estimate in this formula but reduces the residual amount. Consider liquidity, inflation, dependants, survivor benefits and other retirement income, then review a current provider illustration before deciding.
Use primary and provider references to verify current rules, rates, and product terms.
NPS structure and market-linked, voluntary-contribution description.
Market-risk caveat, provider-dependent annuity income, charges and withdrawal-rule caveats.
PPF side of the planning-level comparison; no current interest rate is reproduced.
Instruction to verify current NPS rules, charges, exit conditions and official regulatory updates.
TAKE A 30-SECOND BREAK
Three questions to help the key ideas stick.